

question is not whether it can be measured, but whether it can be measured simultaneously, stably, and explainably.
Single-voxel proton magnetic resonance spectroscopy (SV 1H-MRS) can non-invasively estimate various neurometabolites in the living human brain.
For the research on mental disorders and neurocognitive impairments, the appeal of MRS lies in its ability to link symptoms, circuit functions and neurochemical mechanisms:
For instance, glutamate is related to excitatory transmission, GABA is associated with inhibitory transmission, and glutathione is linked to redox homeostasis and antioxidant capacity.
If only one indicator is considered, it is often difficult to describe the interrelationships among the balance of excitation-inhibition, oxidative stress, and the coupling of glial-neuronal metabolism in the disease state.
This article focuses on a very specific but important issue: How accurate are the existing human brain MRS sequences when simultaneously measuring glutamate, GABA and glutathione?
The word "simultaneously" here is very crucial.
Many metabolic selectivity sequences can optimize the peak of a specific metabolite.
However, when researchers aim to obtain multiple metabolites simultaneously in the same subject, the same voxel, or the same acquisition frame, optimizing one metabolite often results in sacrificing the signal-to-noise ratio, peak separation, or model stability of another metabolite.
The basic judgment of the article is very cautious:
The metabolite-selective sequence does indeed improve the separation of target metabolites and model fitting.
However, there is currently no universal approach that can simultaneously measure glutamate, GABA, and glutathione with high precision under the same set of scanning parameters.
Especially under the 3T condition, the concentrations of GABA and glutathione are relatively low, and the spectral peaks are highly overlapping.
Many methods require the use of spectral editing, long acquisition time and complex fitting models.
As a result, between the stage where MRS "can detect a certain peak" and the stage where it "can reliably compare different individuals or disease groups", there are still issues of precision, repeatability and standardization.
From the perspective of research design, the significance of this article goes beyond merely listing the sequence names.
It serves to remind researchers that when using MRS for mechanism studies, they must take into account the metabolite concentrations, sequence selection, field strength, TE/TR, voxel position, CRLB, CV, tissue correction, and motion control together.
Otherwise, a seemingly significant difference in GABA or glutamate levels might be due to spectral peak overlap, macro-molecular contamination, changes in reference signals, or differences in voxel tissue composition, rather than necessarily being an inherent aspect of the disease mechanism.
Why are these three metabolites considered together?
Glutamate is one of the most important excitatory neurotransmitters in the human brain, and it is also involved in energy metabolism and the neural-glial cycle.
GABA is the main inhibitory neurotransmitter, closely related to cortical excitability, inhibition control, sensory processing and cognitive functions.
Glutathione is an important antioxidant molecule that participates in the redox homeostasis of cells and is also related to glutamate metabolism.
The three are not independent indicators but are nested within each other within the networks of neurons, astrocytes and oxidative stress.
In schizophrenia, bipolar disorder, depression, post-traumatic stress disorder, amyotrophic lateral sclerosis, multiple sclerosis and neurodevelopmental-related issues, changes in excitatory transmission, inhibitory transmission and oxidative stress may all occur simultaneously.
If only glutamate is measured, it may not be possible to observe the compensation of the inhibitory system and the antioxidant system. If only GABA is measured, it may not be possible to determine whether the abnormal inhibition is driven by glutamate.
Even if only glutathione is measured, it is still difficult to explain the relationship between oxidative stress and synaptic transmission.
This is also the reason why the author emphasizes "simultaneous measurement of multiple metabolites".
What clinical and cognitive neuroscience truly requires is not a single indicator, but rather a neurochemical combination that can describe the state of the disease.
The ratio of glutamate to GABA can be used to approximate the balance between excitation and inhibition.
Glutathione provides the background of oxidative stress, and glutamine is related to the glutamate-glutamine cycle.
The future value of MRS largely depends on whether it can move from the comparison of single metabolites to a repeatable multi-metabolite model.
MRS measurement challenges: spectral peak overlap, low concentration and J coupling
MRS does not directly "capture" a specific metabolite, but rather observes the resonance signals of hydrogen protons in different chemical environments within the spectrum.
The problem lies in the fact that the spectral peaks of brain metabolites often overlap with each other.
Glutamate, glutamine, GABA, glutathione, NAA, creatine and macromolecular signals may all appear within a similar frequency range.
Especially at a 3T field strength, the spectral peak dispersion is limited, and it is more difficult for low-concentration metabolites to be separated from the strong peak background.
The difficulty with GABA is particularly notable.
The concentration of GABA in the body is approximately 1-2 mM, which is significantly lower than many of the commonly observed metabolites.
Moreover, its multiple methylene peaks are distributed around 1.89, 2.28, and 3.01 ppm, overlapping with signals such as NAA, glutamate, and creatine.
The MEGA-PRESS spectral editing method is precisely designed to address this issue: by using ON/OFF editing for pulses and subtracting them, it retains the target coupled signal while suppressing the unwanted background signal.
However, the cost is a decrease in signal-to-noise ratio, an increase in acquisition time, and greater sensitivity to frequency drift and head movement.
The difficulty with glutamate is different.
The concentration of glutamate is relatively high, approximately 6.0 - 12.5 mmol/kgww, but it is highly overlapping with glutamine, especially around 2.35 ppm.
The gamma multiplicity peak of glutamate will be close to the glutamine signal.
High field strength can increase the spectral peak dispersion, which is beneficial for distinguishing glutamate and glutamine.
Short TE is beneficial for preserving signal strength and reducing the signal loss caused by transverse relaxation.
Glutamate is not "invisible", but rather "whether it can be independently modeled separately from adjacent metabolites".
Glutathione has two problems: low concentration and a complex profile.
It is composed of glutamic acid, cysteine and glycine structures, and the relevant peaks include multiple positions such as 2.15, 2.55, 3.77, 2.93, 2.98, 4.56 and 7.15 ppm.
Its intracellular concentration is approximately 1.5 - 2 mmol/L, and it is prone to overlap with glutamate, GABA, glutamine, etc.
The article states that HERMES is commonly used to target both GABA and glutathione simultaneously, but it remains challenging to reliably quantify metabolites with concentrations lower than 3 mM at 3T.
Literature inclusion status: 17 studies have demonstrated the current technological limitations
The author conducted a systematic review by searching PubMed, ProQuest MedLine, OVID PsychINFO and Web of Science using the following keywords: glutamate, GABA, glutathione, proton magnetic resonance spectroscopy and human brain.
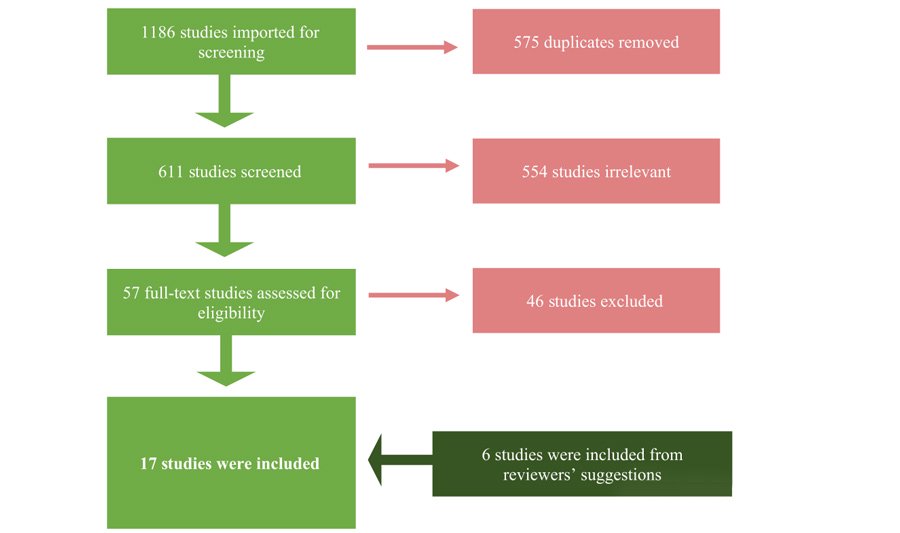
The initial search yielded 2127 articles. After applying the filter for human studies, 1186 articles remained. Finally, 17 studies were included.
These studies need to meet a core requirement: report two or three target metabolites in the same study and provide quality indicators such as CRLB or CV.
The initial number of screened papers was 1186. After removing duplicates, 611 papers were selected, and 57 of them were further evaluated in full text. Finally, 17 studies were included.
Among the studies included, 12 used 3T scanners and 5 used 7T scanners.
The total sample consists of 218 healthy controls, among which 18 are healthy newborns, and the remaining 80 are patients with mental or neurological disorders.
Common sequences include PRESS, MEGA-PRESS and HERMES. The most frequently studied brain regions are the anterior cingulate cortex.
Among the included studies, GABA was reported the most frequently, while the simultaneous reports of glutathione and glutamate were relatively less frequent.
This result itself indicates the current situation in this field: Although clinical research requires the simultaneous observation of excitatory, inhibitory and oxidative stress indicators, there are not many studies that can simultaneously report these metabolites and provide accuracy indicators.
In the MRS literature, what can truly be used for methodological comparison is not "reporting a certain metabolite", but "reporting metabolites, sequence parameters, voxel positions and quality indicators".
core difference between sequences: selection between edited sequences and single-shot acquisition sequences
The article roughly divides the main methods into two categories.
The first category is sequence editing programs, such as MEGA-PRESS, HERMES, HERCULES and J-difference editing.
This type of method enhances the signal of the target metabolites by selectively editing the pulses and performing spectral subtraction.
It is suitable for detecting low-concentration and highly overlapping metabolites, especially GABA and glutathione.
The second category consists of non-editing or one-time acquisition methods, such as PRESS, SPECIAL, sLASER, short TE STEAM, etc.
These methods do not rely on ON/OFF subtraction.
They usually have better signal-to-noise ratio and time efficiency, but have higher requirements for the model of overlapping peaks.
MEGA-PRESS is the most renowned editing technique in GABA MRS.
It usually utilizes the multiple peaks of GABA at 1.89 ppm to influence the 3.01 ppm signal.
After subtracting them in the ON/OFF acquisition, the GABA signal is highlighted.
The commonly used TE value is 68 ms, which can yield a relatively good GABA peak, but it will introduce macromolecular contamination.
TE 80 ms helps to reduce the influence of macromolecules, but it may also alter the signal strength and the ability to detect other metabolites.
TE is not a neutral parameter; it will alter the target peak, the source of pollution, and the interpretability.
HERMES can be regarded as an extension of multiple editing ideas, where Hadamard encoding is used to simultaneously edit multiple metabolites in the same sample.
The article states that HERMES has become one of the main alternative options for MEGA-PRESS, capable of simultaneously detecting GABA and glutathione, as well as GABA and glutamate/glutamine indices.
Among the studies included, the CV (coefficient of variation) reported by HERMES was approximately 17% - 27% for GABA, 19% - 29% for glutathione, and 6% - 20% for glutamate.
These figures indicate that it has practical value, but it still does not reach the ideal state where all metabolites are highly repetitive.
The advantages of methods such as PRESS, SPECIAL, and sLASER lie in their ability to collect data that is closer to a single-point measurement.
They do not require the subtraction of spectra from two different time points, so they are theoretically less sensitive to motion and frequency drift, and can retain more of the overall signal.
However, they usually cannot separate the low-concentration target peaks as cleanly as in spectral editing.
Especially when a parameter is optimized for glutamate, the CRLB and CV of GABA or glutathione may deteriorate.
The core trade-off repeatedly emphasized in the article is the contradiction between the selectivity of metabolites and the signal yield/signal-to-noise ratio.
CRLB and CV: One assesses lower bound of fit, other assesses actual variation
This article places particular emphasis on the definitions of CRLB and CV.
CRLB, namely Cramer-Rao lower bound, is typically used to estimate the theoretical lower bound of the uncertainty in spectral fitting parameters.
It reflects the lowest observable uncertainty in the amplitude estimation of a certain metabolite under the given model, noise and spectral shape conditions.
If the CRLB of a certain metabolite is very high, it indicates that the model has difficulty in accurately estimating it from the spectrum.
Common reasons include weak peaks, severe overlap, insufficient SNR, or an insufficient fitting basis set.
CV, which stands for coefficient of variation, is usually the ratio of the standard deviation to the mean, reflecting the relative variation across individuals, repeated measurements, or research samples.
The article points out that CV is not merely about algorithmic uncertainty;
it also encompasses real individual differences, collection variations, movement, voxel placement, tissue composition, and changes in reference signals, among other factors.
A low CRLB does not necessarily mean that the CV is also low.
CRLB is more of a fitting-level accuracy indicator, while CV is closer to the repeatability and variability levels encountered in actual research.
The author believes that for in vivo MRS, a CRLB value of less than or equal to 10% is an ideal situation, as this indicates that the inter-group variation is more likely to be driven by individual differences rather than by algorithmic or methodological errors.
Among the studies included in the research, there were indeed a few that achieved CRLB ≤ 10% for certain metabolites.
However, not a single study reported on two or three target metabolites simultaneously, and in all cases, the CV for all related metabolites did not reach 10%.
This indicates that the current technology can perform well under certain local conditions, but it has not yet developed a comprehensive and highly accurate solution applicable to the joint modeling of multiple metabolites.
When reading the MRS paper, one should not merely focus on "significant differences between groups" or "the detectability of a certain metabolite".
It is even more necessary to examine the CRLB, CV, SNR, spectral line width, voxel position, reference method and fitting software of this metabolite.
If the CRLB (combined likelihood ratio) of a low-concentration metabolite is very high, or if the CV (coefficient of variation) is significantly greater than expected, then the inter-group differences in a small-sample clinical study of this metabolite need to be interpreted with caution.
Metabolite differences without the support of quality indicators are difficult to be transformed into reliable mechanistic evidence.
key issue with GABA: Many of results are actually GABA+
The MRS measurement of GABA is easily affected by macromolecular signals.
Many research reports deal with GABA+ which refers to GABA combined with macromolecular contamination, rather than the truly pure GABA.
Macromolecular contamination may originate from broad peak signals that are close to the editing frequency of GABA.
If no specific correction is carried out, the concentration of GABA may be overestimated or there may be inter-group deviations.
The article states that uncorrected macromolecular contamination can reach a considerable proportion.
Therefore, when interpreting the GABA results, it is necessary to clearly understand whether the author reports GABA or GABA+.
This is particularly important for clinical research.
Suppose a study finds that the GABA level in the patient group is lower than that in the control group.
This could indicate a decrease in GABA itself, or it could reflect differences in the macromolecular background, tissue composition, or spectral fitting.
If the disease affects the ratio of gray matter to white matter, the inflammatory state, or the extracellular environment, the macro-molecular signals may also change.
GABA+ is a useful indicator, but it is not a synonym for "pure GABA".
The article also discusses frequency drift.
The precise subtraction of the ON/OFF spectra based on the editing sequence is affected.
If the main magnetic field drifts during the scanning process or the subject moves slightly, the position of the editing pulse relative to the target peak will shift, resulting in poor alignment of the ON/OFF spectra and generating subtraction artifacts.
This will simultaneously affect both the target metabolites and the non-target signals.
For children, the elderly and patients with mental illnesses, this issue is more practical because it is more difficult to remain still for a long time.
Therefore, in the GABA research, the reporting of sequence names is far from sufficient.
It is necessary to clarify the TE (time-equivalent) value, the position of the editing pulse, whether macro-molecular inhibition is performed, whether frequency drift is corrected, how many averaging times are retained, whether abnormal averages are excluded, how the fitting basis set is constructed, and whether the results are expressed in absolute concentrations corrected by water, creatine, or tissue.
Glutamate and Glutathione: One is limited by overlap, other by low concentration.
The advantage of glutamic acid is its high concentration, but its drawback is the difficulty in separating it from glutamine.
Many papers use Glx to represent the combined index of glutamate and glutamine.
This is reasonable in some studies. However, if the research question clearly focuses on the transmission of glutamate, Glx might be too crude.
High-field strength 7T can enhance the chemical shift resolution, making it easier to separate glutamate and glutamine.
However, the accessibility of 7T, the B0/B1 inhomogeneity, SAR limitations, and cross-center standardization bring new problems.
The challenge with glutathione lies more in its low concentration and complex spectral peaks.
It is difficult to conduct quantitative analysis at 3T. HERMES can enhance the detection by targeting the 4.56 ppm, 2.9 ppm or 2.1 ppm related components.
However, the CRLB and CV in different studies will still be affected by voxel size, brain region and sequence parameters.
The article states that in some HERMES studies, the CRLB can be lower than 10%, but the CV is approximately 15% to 30%, indicating that even when the fit appears stable, the actual sample variation can still be quite large.
Here is an important point to note: In MRS, "detected" and "precise quantification" are not the same thing.
The detection of a visible peak merely indicates the presence of a signal related to the target metabolite in the spectrum.
Accurate quantification requires the separation of peaks from the background, stable model, reliable reference signal, and acceptable variation in repeated measurements.
For metabolites with low concentrations and complex spectral peaks, the real challenge lies in accurately and stably estimating the peaks from the mixed signals.